Why Stock Indexes Ended This Week in the Red
Understand this faster with AI
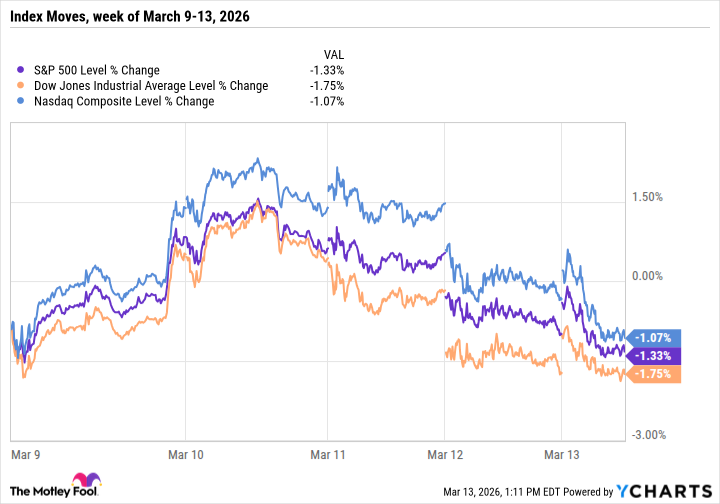
By Anders Bylund – Mar 13, 2026 at 2:02PM ESTKey PointsThe Iranian blockade of the Strait of Hormuz sent oil prices soaring this week.Energy stocks rose but make up less than 4% of the S&P 500, limiting their impact.Goldman Sachs and Home Depot each dropped 6%, dragging down the Dow.The stock market is ending a rough week. The leading stock indexes rose on Monday and Tuesday as the conflict in Iran seemed destined for a quick resolution. But the fighting only intensified from there, including an Iranian blockade of oil shipments through the critical Strait of Hormuz, which led to skyrocketing oil prices. That's bad news in an era when AI data centers are consuming more electricity than ever, often generated by burning oil or natural gas. The combination of intense energy demand and limited supply also raises questions about the global economy. So the Iranian crisis is weighing on tech stocks, banks, and consumer goods giants alike. The only winners this week have been -- you guessed it -- energy producers and utility services. ^SPX data by YCharts Energy stocks can't carry the market alone As expected, most market indexes ended the week on a low note. Sure, energy stocks with limited operations in the Persian Gulf rose significantly but that wasn't enough to outweigh the secondary effects of high oil prices. After all, the entire energy sector accounts for just 3.4% of the S&P 500's (^GSPC 0.26%) total market value. Most of the energy giants trade on the New York Stock Exchange, so the energy footprint on the Nasdaq Composite (^IXIC 0.68%) index works out to just 1% of the tech-heavy stock list. And the only energy stock in the Dow Jones Industrial Average (^DJI +0.09%) is Chevron (CVX 0.01%). With a share price just below $200, it carries a 2.4% weight on this price-weighted index. Even a large Chevron jump would barely move the Dow's needle overall. ExpandDJINDICES: ^DJIDow Jones Industrial AverageToday's Change(0.09%) $43.13Current Price$46720.98Key Data PointsDay's Range$46565.53 - $47123.9952wk Range$36611.78 - $50512.79Volume293M The Magnificent 7 had a terrible week The Dow took heavy hits from a 6% price drop in Goldman Sachs (GS 0.36%) this week, followed by another 6% retreat for Home Depot (HD +0.27%). The S&P 500 and Nasdaq Composite took their leading cues from several of the Magnificent 7 stocks, each losing more than $100 billion of market value over the same period. Amazon (AMZN 0.67%) took the deepest cuts, with its market cap shrinking by $120 billion compared to last Friday. Amazon is investing $200 billion in AI-processing data centers this year, so there's a direct link to rising power costs. Image source: Getty Images. The Iranian conflict will probably continue to set the market's overall tone until it winds down. It may feel like a bear market, but the downdraft is still far too weak for that moniker. The three top indexes still trade less than 7% below their recent all-time peaks, and this week's total drops clocked in below the 2% mark across the board. The bearish tag only appears after S&P 500 drawdowns of at least 20% from a recent high. The storm clouds are gathering, centered around Iran and the Strait of Hormuz. It's too early to panic, but you may want to prepare for some rough seas.Read NextMar 12, 2026 •By Howard SmithStock Market Today, March 12: Oil Prices Surge After Iran War Fears Spark Broad Market SelloffMar 6, 2026 •By Howard SmithStock Market Today, March 6: Energy Stocks Rise as Oil Closes Over $90 on Middle East TensionsMar 6, 2026 •By Anders BylundWhy the Nasdaq Is Holding Up Better Than the Dow and S&P 500 On FridayMar 2, 2026 •By Sean WilliamsThe Dow Jones Industrial Average Just Did Something That's Been Witnessed Only 6 Times in 130 Years -- and It's a Highly Bullish Indicator for Wall StreetFeb 27, 2026 •By Anders BylundWhy the Dow Is Holding Up Better Than the Nasdaq and S&P 500 TodayFeb 25, 2026 •By Anders BylundWhy the Nasdaq Is Beating the Dow and S&P 500 TodayAbout the AuthorAnders Bylund is a contributing Motley Fool media and technology analyst covering semiconductors, cloud computing, internet infrastructure, quantum computing, and streaming media. Previously, Anders was a systems administrator for Nielsen Technology and CSX, gaining hands-on experience with enterprise-class systems. He was also a freelance writer for Ars Technica, TIME, USA Today, CNN, WIRED, and AOL's Daily Finance. He holds a bachelor’s degree in English and a master’s degree in library and information sciences from Florida State University. He believes in coyotes and time as an abstract.TMFZahrimX@TMFZahrimStocks MentionedDow Jones Industrial AverageDJINDICES: ^DJI$46,708.67(+0.07%)+$30.82S&P 500 IndexSNPINDEX: ^GSPC$6,656.56(-0.24%)-$16.06Home DepotNYSE: HD$339.79(+0.25%)+$0.86Goldman Sachs GroupNYSE: GS$784.41(-0.40%)-$3.11AmazonNASDAQ: AMZN$208.22(-0.63%)-$1.31NASDAQ Composite IndexNASDAQINDEX: ^IXIC$22,171.32(-0.63%)-$140.66ChevronNYSE: CVX$196.93(-0.02%)-$0.04*Average returns of all recommendations since inception. Cost basis and return based on previous market day close.
Tags
Source Information
Discussion
0 professional contributions
Sign in to join this professional discussion.
Be the first to add a constructive contribution.